GCC Map Comparison Background information
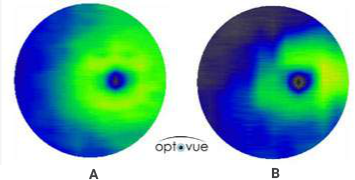
The GCC map for a normal eye shows a bright circular band surrounding the macula representing a thick GCC from healthy ganglion cells (figure A). The center of the macula is thinner because there are no ganglion cells in this area. In glaucoma, as the ganglion cells are lost, the GCC complex becomes thinner (figure B).

The GCC thickness values are analyzed and compared to an extensive normative database. This normative database contains over 300 healthy eyes from various ethnicities with an age range from 18-80. The results are presented in two maps and a parameter table. The Deviation Map shows the percent loss from normal as determined by the normative database. The map is color coded where blue and black represent GCC thinning. A 50% loss in this map means that this patient has a GCC layer that is 50% thinner than normal. All Deviation and Significance Maps have a circular mask in the center of the macula where the analysis is not possible due to an absence of ganglion cells in this region.


